
You are here
Results
 The ability to measure daily water applications and leaching losses from both Maple and Birch blocks has been a major innovation.
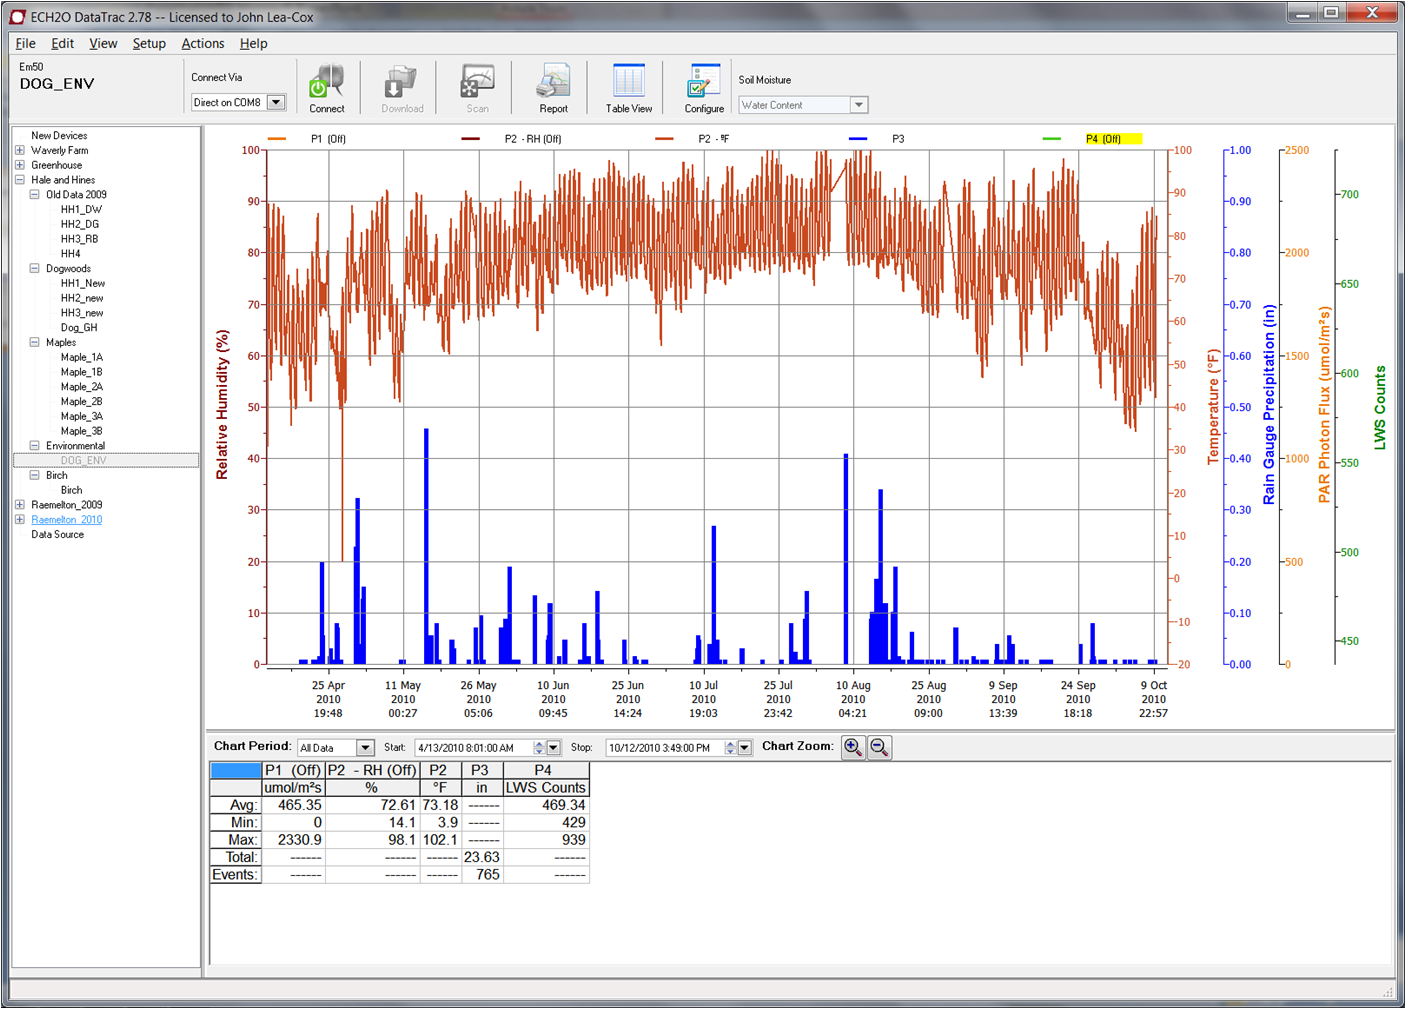
2010 Rainfall and air temperature data for Hale and Hines nursery. The summer was extraordinarily hot, with daily temperatures above 90F from June through August. Rainfall totaled 23.6” between April and September, but the majority of that rain occurred in about 10-12 events (Screenshot at right).
Consequently, irrigation water demand was high for throughout the summer.
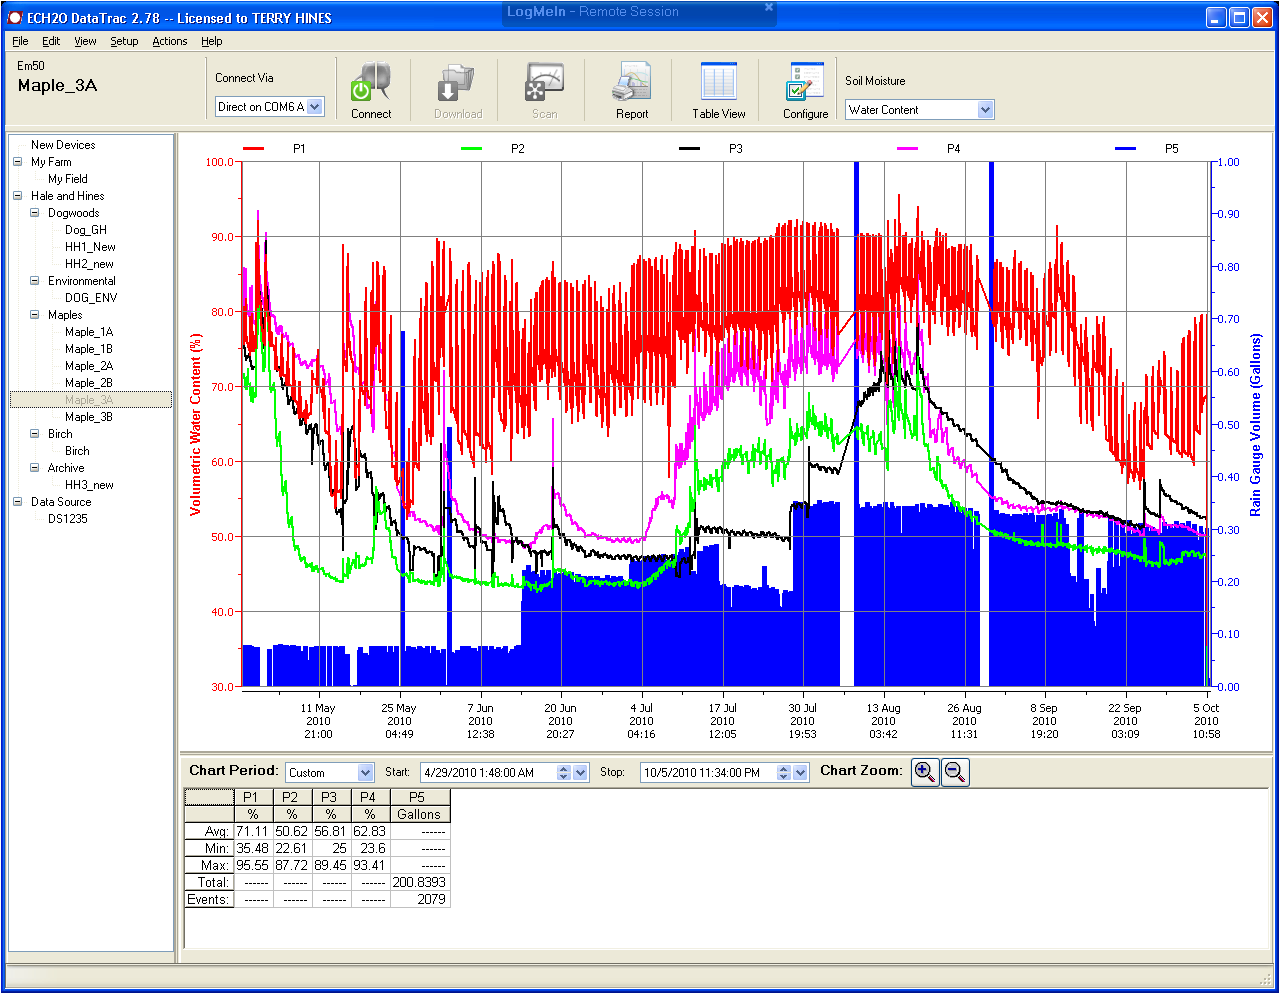 2010 Maple Sensor Data (Tree #3; top quadrant)
The screenshot at right is from one of the Maple trees that was intensively sensored throughout 2010 (see sensor deployment page for description). The data is from 4 sensors at 6 inch depth in each of four quadrants around the trunk (N, E, S and W).
The Blue bars indicate irrigation applications; 200 gals of water was applied to this particular tree from May through October (not including rainfall).
The red lines are from the sensor directly under the dripper (N). The other sensors (e.g. black and green lines) are in the “irrigation shadow” of the trunk or side of the container; lower volumetric substrate contents were often seen in these quadrants.
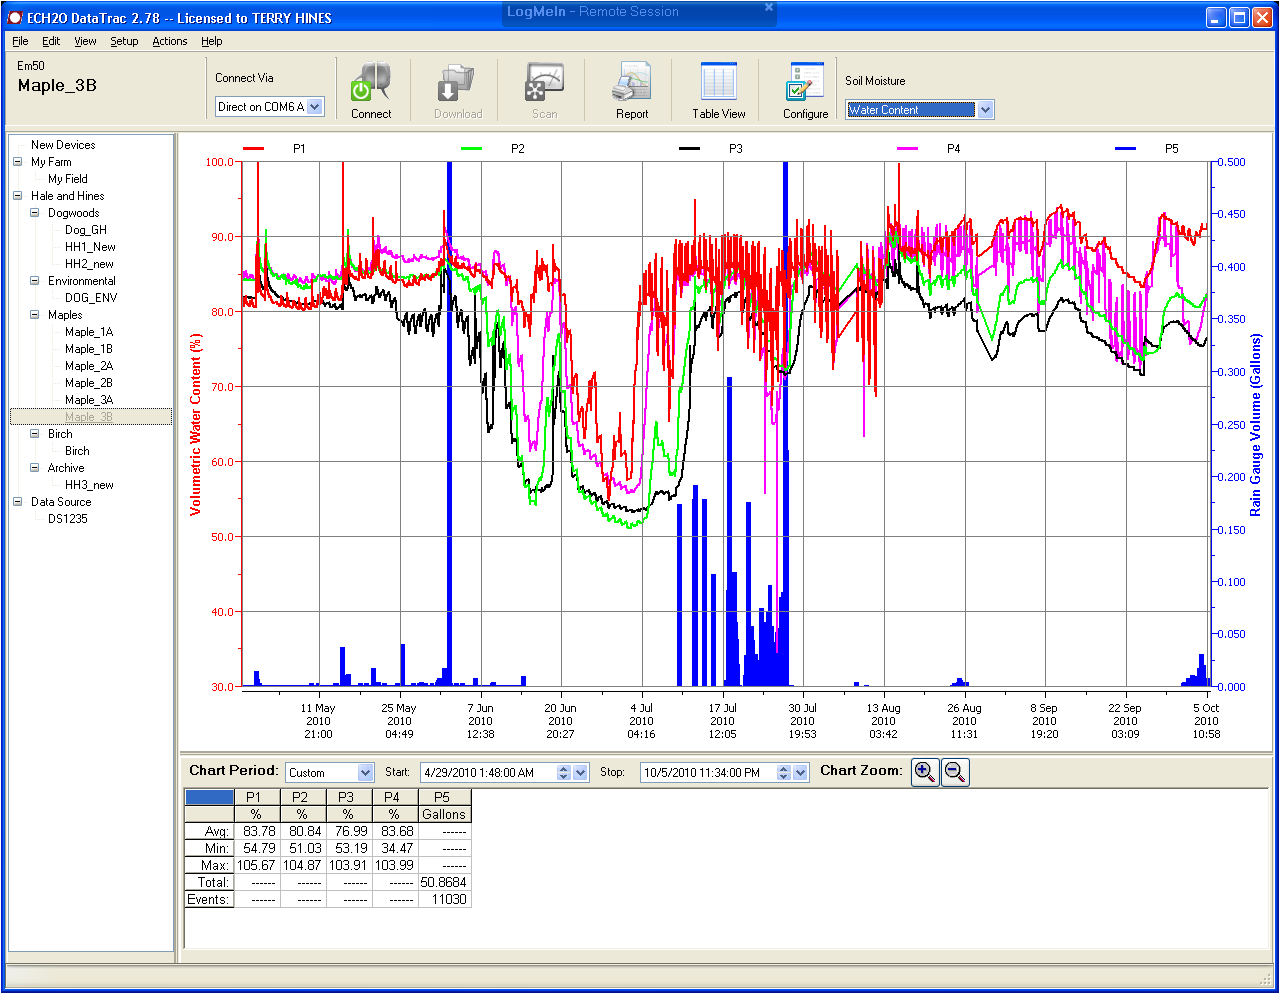 2010 Maple Sensor Data (Tree #3; lower quadrant)
These data at right are from exactly the same tree, except for the fours sensors (NE, SW, SE and NW) at 12" depth. Note that the substrate mositure is most often much higher in the lower part of the rootball.
The blue bars in this case indicate leaching volumes; 51 gals of water leached from this tree from May through October. The majority of this leaching appeared to be associated with increased irrigation volumes and additional rainfall in early July.
This may have also been associated with reduced transpiration due to high daily temperatures. Note that irrigation volumes were adjusted down by Terry Hines after 16 July.